
How to Interpret Your Ad Insights Dashboard Like a Pro
Given the abundance of data and information tracking these days, most marketers do not suffer from a lack of details. If anything, they actually struggle with making sense of it all.
Today, marketing dashboards are packed with numbers, charts, and filters. On paper, everything looks sophisticated, like a high-tech interface you’d see in sci-fi movies of yesteryear. But in reality, many teams still rely on gut feeling when making decisions. That gap between data and action is where performance is mostly lost.
A recent study found that more than half (56%) of businesses now rely on data dashboards to make decisions daily. Even so, the leap from seeing a number to knowing how to respond remains a common challenge.
So, how do you move past the “pretty charts” and start seeing the actual story they're trying to tell?
This guide breaks down how to interpret your dashboard with clarity and turn those insights into decisions that drive better performance.
- What Are Marketing Dashboards (and Why Do They Matter)?
- The Core Metrics You Need to Understand First
- How to Analyze Ad Performance Like a Pro
- How to Track Ad Performance Effectively
- How an Ad Reporting Tool Simplifies Everything
- Go Beyond Your Data with Competitor Insights
- Go From Data Overload to Clear Decisions with OptAdEasy
What Are Marketing Dashboards (and Why Do They Matter)?
Think of marketing dashboards as your command center. Instead of wasting time “tab-hopping” between different platforms to see how your budget is holding up, you get a single, high-level view of every active campaign.
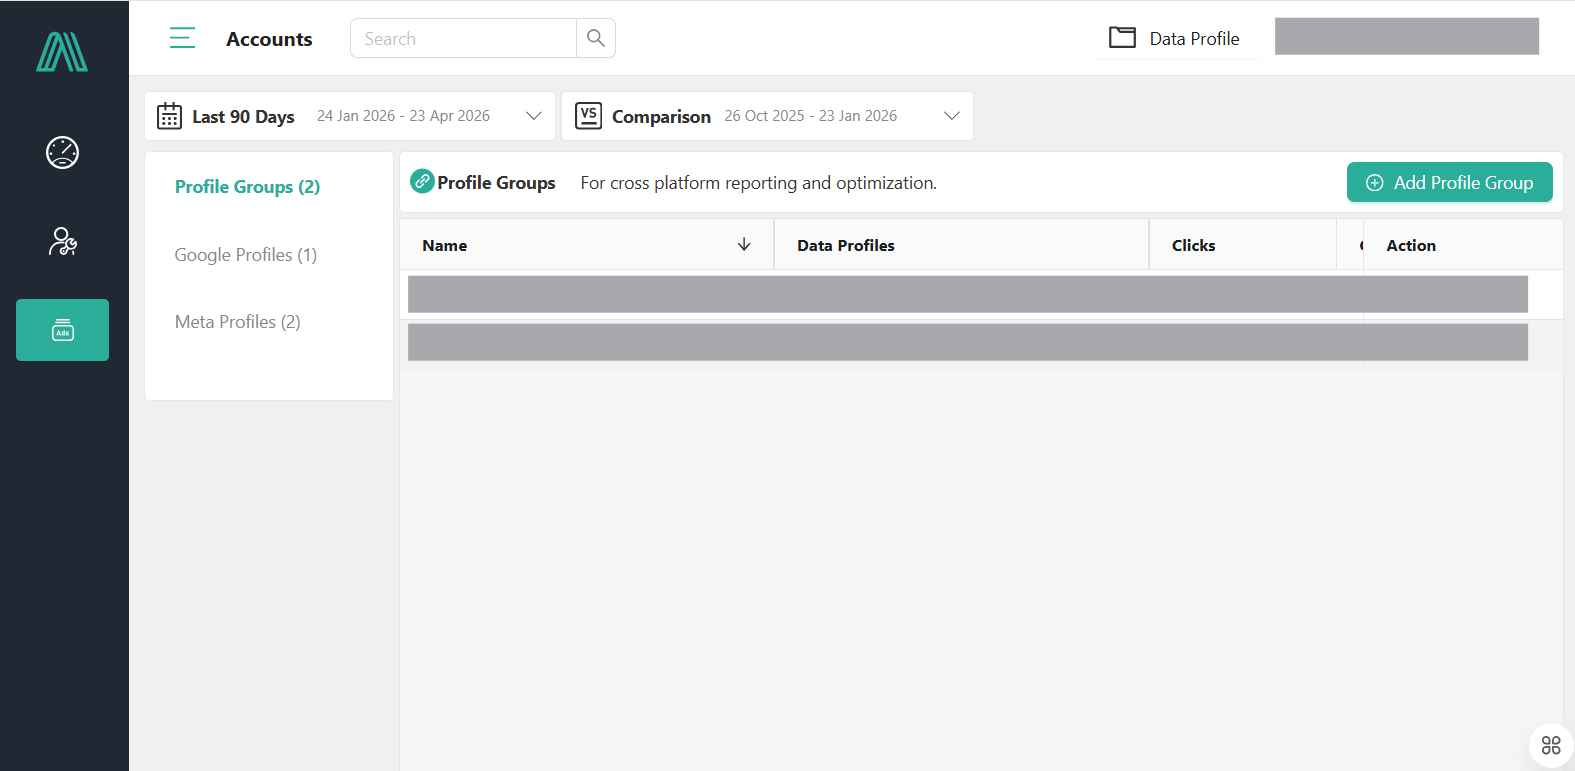
OptAdEasy allows you to connect Google and Meta profiles into a unified Profile Group for a holistic view.
It doesn’t matter if you’re staring at a Google Ads dashboard or a cross-channel report; the objective is almost always the same. You’re looking for the "so what?" behind the numbers. Which campaigns are driving results? Which are underperforming? Where should you adjust/improve your strategy next?
This is the bridge between raw analytics and actual results. Without a layer of human interpretation, a digital marketing dashboard is just a glorified spreadsheet.
Most tools, including platforms like OptAdEasy, follow a similar structure. Once you get a feel for the layout, the logic is universal. You'll usually see:
- The Big Picture: Core KPIs like ROI, ROAS, and CPA.
- The Trend: How performance compares over time.
- The Source: Which channels are contributing the most.
- The Creative: Which specific ads are delivering results.
- The Who: Basic audience breakdowns and demographics.
The Core Metrics You Need to Understand First
Before diving into interpretation, you need a solid grasp of the fundamentals. This is the starting point for anyone learning how to analyze ad performance.
Here are the essentials you’ll see on almost every dashboard:
Click-Through Rate (CTR)
Shows how often people click on your ad after seeing it. As a general benchmark, Google Search ads tend to see average CTRs between 3.17% and 6.11%, depending on the industry.
Cost Per Click (CPC)
Shows how much you pay for each click, giving you a quick sense of cost efficiency.
Cost Per Acquisition (CPA)
Tells you how much it costs to generate a conversion or acquire a lead.
Return on Ad Spend (ROAS)
Measures how much revenue you generate for every dollar spent on ads.
Conversion Rate
This is the “finish line” metric that tracks how many people actually took action after clicking.
The real insight comes from how these metrics interact. For example, a high CTR combined with a low conversion rate usually means your ad is drawing attention, but something breaks down after the click. On the flip side, a moderate CTR with strong conversions tells a very different story.
If you want a deeper dive into these terms and more, refer to the “Complete Glossary of Paid Digital Advertising Terms" for a full breakdown.
How to Analyze Ad Performance Like a Pro
Understanding the numbers is one thing, but knowing what to do with them is another. This is where you move from reporting on the past to making smarter decisions for what comes next.
If you want to stop guessing and start optimizing, you need a repeatable process. Here is how to analyze ad performance in a way that actually drives results:
1. Start with Trends, Skip The Snapshots
Looking at a single day or week rarely tells the full story, as performance fluctuates naturally. Thus, short-term data can be misleading. Instead, use time comparisons to spot patterns easily:
- Are conversions improving over time?
- Is CPA increasing after a campaign change?
- Did performance shift after a budget adjustment?
Most marketing dashboards allow you to compare date ranges, and this simple step often reveals trends that are easy to miss.
2. Identify the Biggest Movers
Not all fluctuations deserve your attention, so stop treating every metric like it’s equally important to avoid spreading your focus too thin. You’ll find the most impact by hunting for the outliers. For example, campaigns that suddenly dropped in performance, ads that spiked unexpectedly, or any metric that changed sharply over a short window.
These aggressive shifts usually signal where your biggest risks or your best opportunities are hiding. Instead of wasting time on a broad, surface-level review, focus your energy on what actually moved the needle.
Tip: OptAdEasy features a specific Biggest Movers filter designed to highlight these shifts instantly.
3. Break Down Performance by Channel
Each platform plays a different role in the funnel, so comparing them directly without context leads to poor decisions. While your Google Ads dashboard might be showing high-intent searches, your social ads are likely doing the heavy lifting for awareness and brand discovery. To get a clearer picture of where your budget is actually working, you need to look at how cost efficiency and conversion rates stack up across the board, specifically noting how each one contributes to your bottom line.
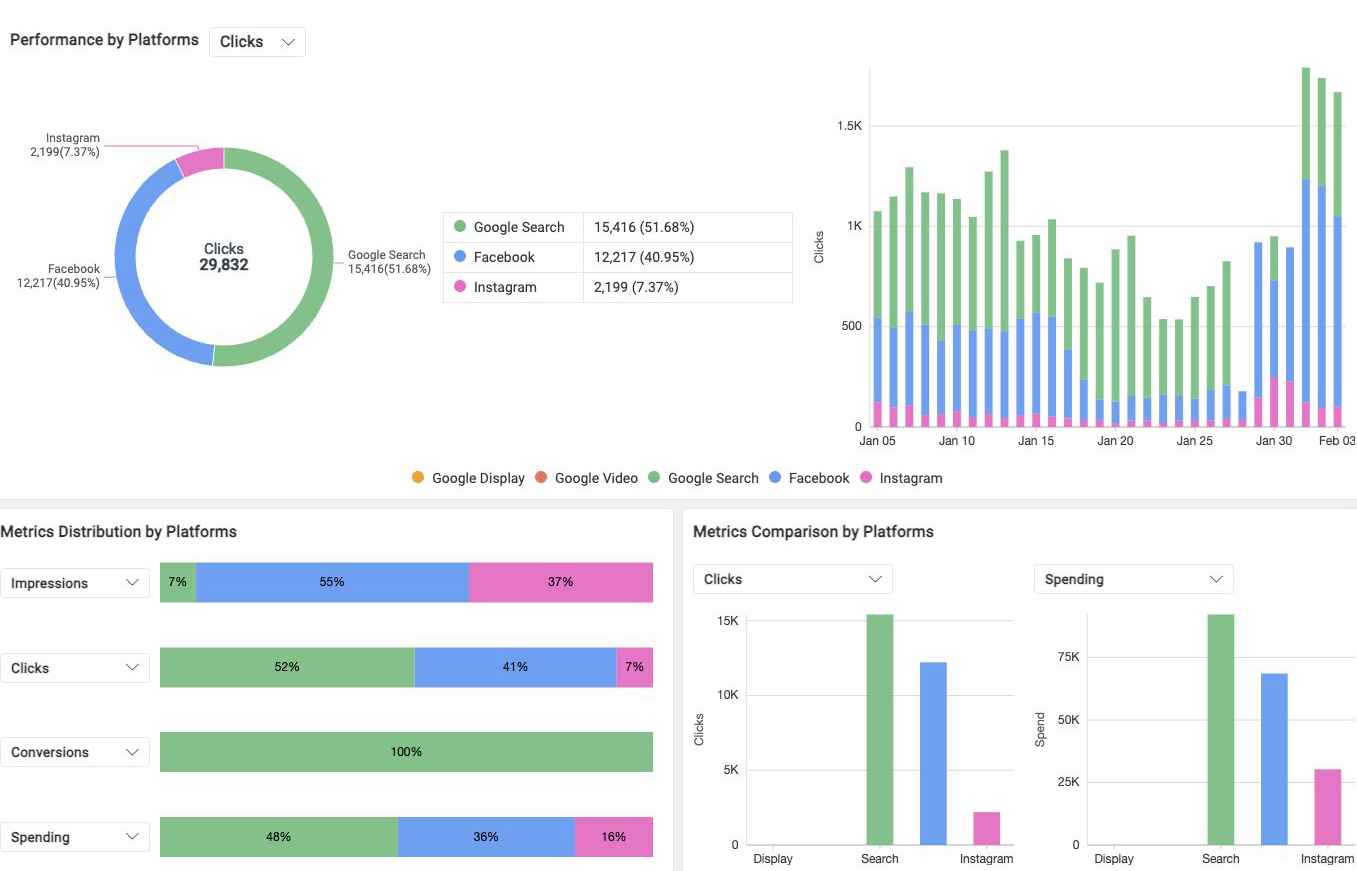
Use OptAdEasy’s Performance by Platforms and Metrics Comparison by Platforms to see how each contributes to your bottom line.
This high-level comparison is what allows you to stop guessing and start shifting towards confident budget allocation.
4. Focus on Your Top-Performing Ads
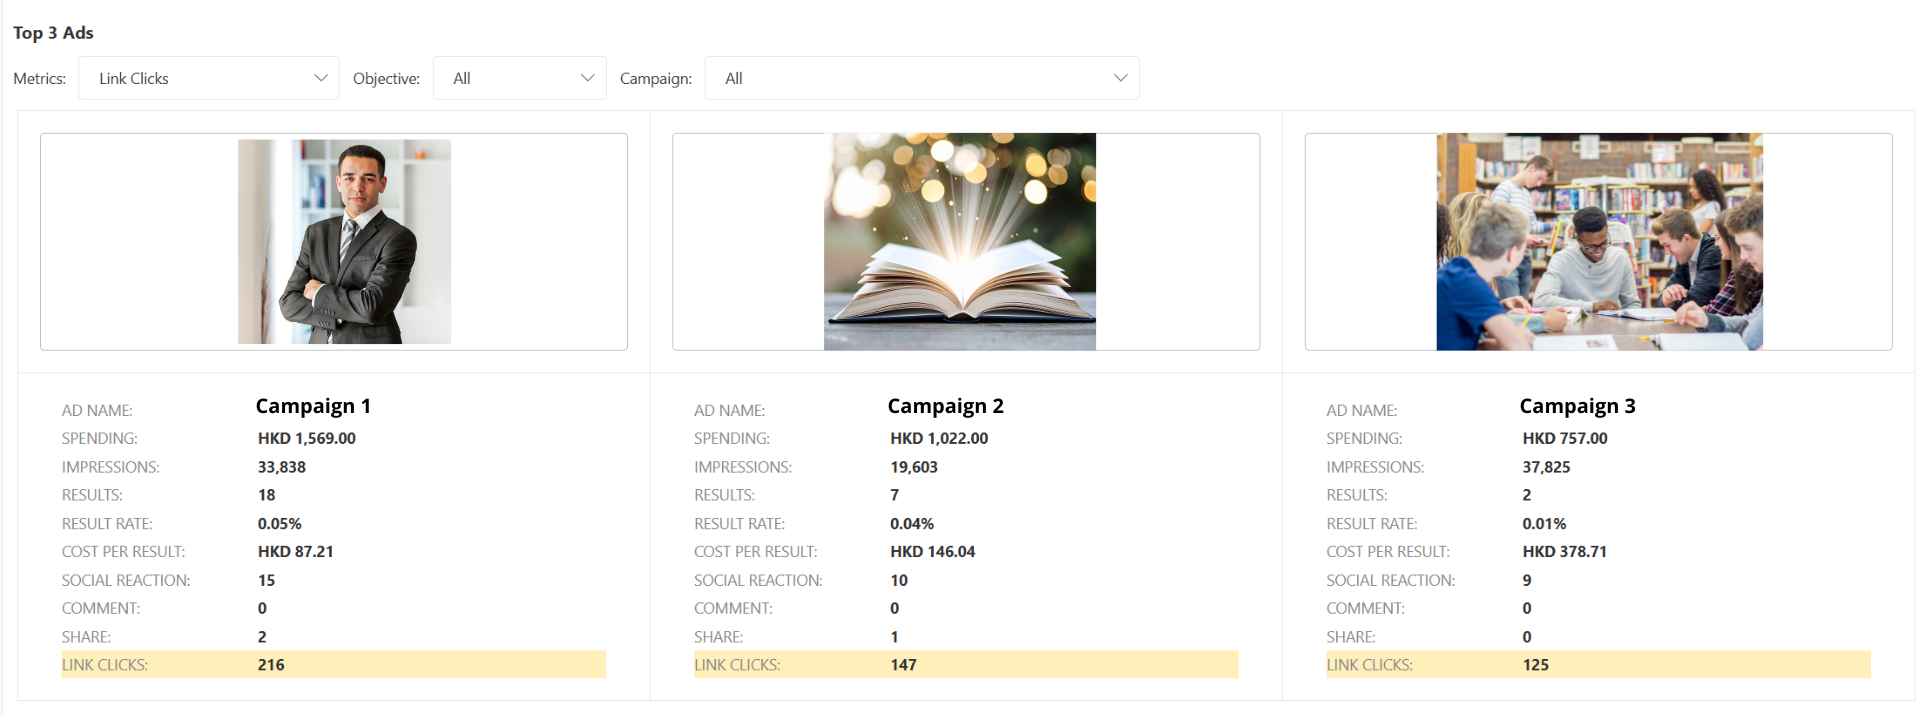
Every campaign eventually reveals a few clear standouts that outperform the rest. Rather than constantly experimenting with new ideas or over-testing unproven concepts, look for creatives and messaging that are already driving high conversion rates and genuine engagement.
To do this effectively, OptAdEasy allows you to use the Top Ads filter to instantly isolate these exceptional performers.
Once you identify what is actually resonating with your audience, your job shifts from experimentation to refinement. Take those top-tier performers, polish and scale them up. It's almost always more effective to pour fuel on a fire that’s already burning than to try to start ten new ones from scratch.
5. Understand Your Audience Segments
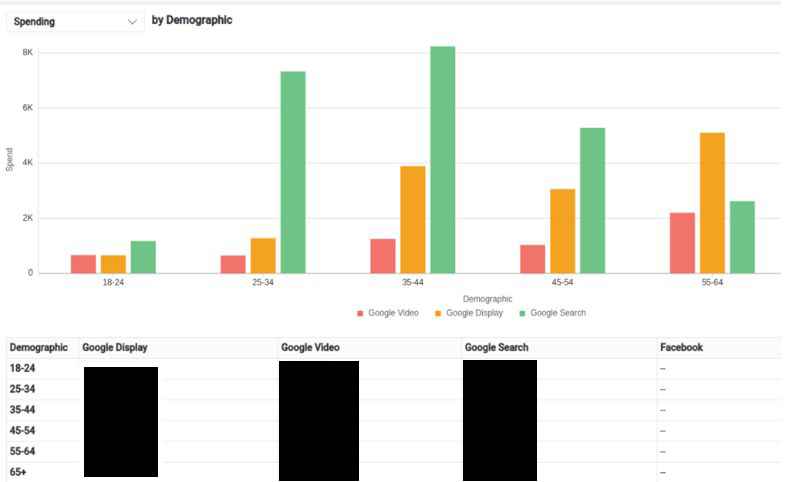
Peel back the layers by filtering for Gender, Age, and Demographic on OptAdEasy.
The data often tells a different story than your initial assumptions. Even the most well-planned campaigns can miss the mark on who is actually clicking and buying, so you need to peel back the layers to see who is truly moving the needle.
- Age and Gender: Look for specific brackets that are over-indexing on conversions rather than just clicks.
- Segment Overlap: Identify which specific interest groups or behaviors are actually driving your ROI.
- Targeting Pivots: Identify where your "accidental" successes are happening.
In many cases, your most profitable customers are not the ones you originally targeted. In actuality, shifting your budget toward the people who are converting (rather than the ones you hoped would convert) can help you unlock a massive performance boost without spending anything extra.
How to Track Ad Performance Effectively
To reiterate, the biggest trap in marketing is not having too little data but having too much. Many teams try to monitor everything, but learning how to track ad performance effectively usually means doing just the opposite.
To stay sharp, you need to focus on the specific metrics that align with your goals. For instance, look at reach and CTR for awareness. For conversions, focus on CPA. Lastly, for revenue, track ROAS closely.
Clear priorities lead to cleaner digital marketing analytics, which makes your data easier to interpret and act on. Once your data is structured, the next step is action. A dashboard is only a collection of charts unless it triggers one of four tactical moves:
-
Budget Allocation: Reallocate spend toward campaigns that are delivering results.
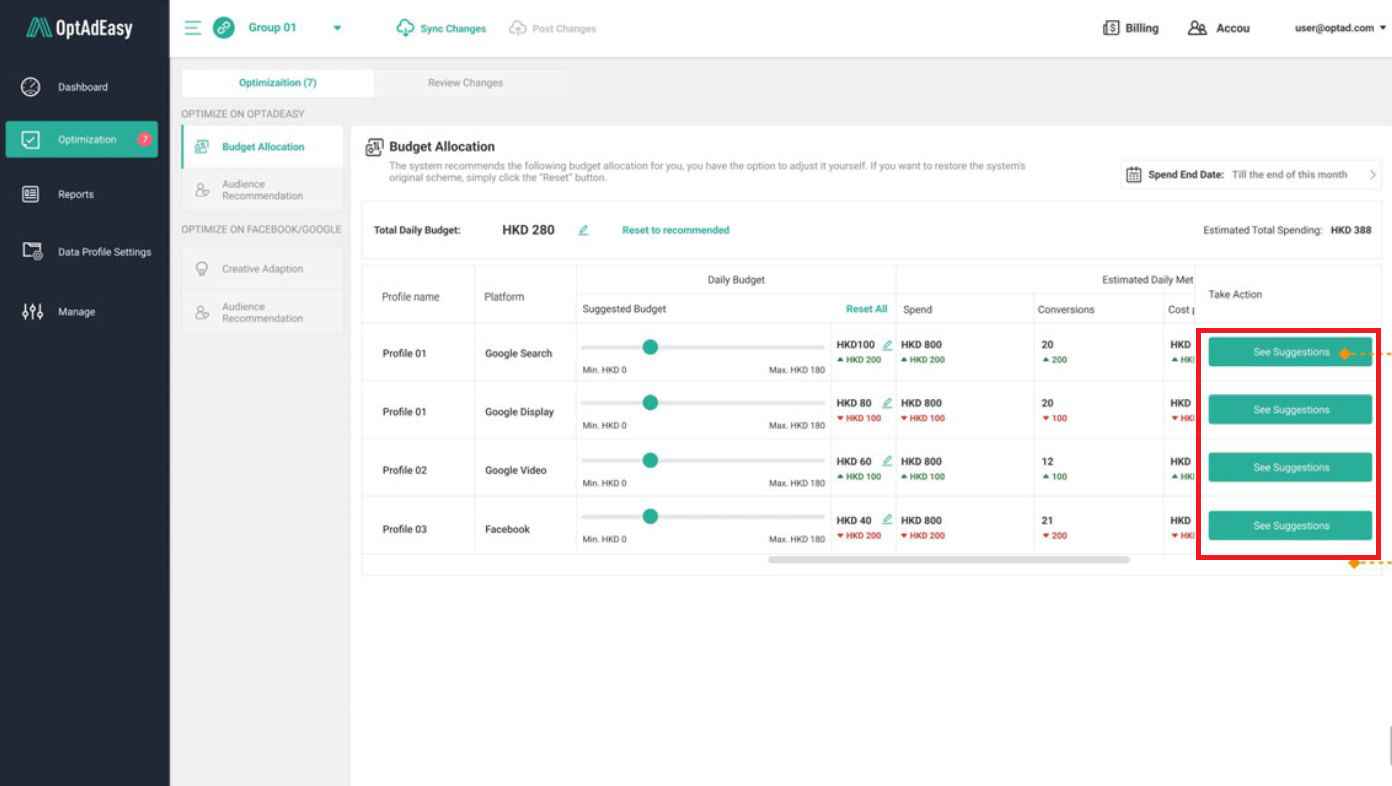
OptAdEasy provides Budget Allocation suggestions, even identifying campaigns that should be paused due to low conversion rates.
- Creative Optimization: Pause underperforming ads and build on what is working.
- Targeting Refinement: Focus on audience segments that are actually converting.
- Account Cleanup: Remove overlap and streamline your campaign structure.
The reality is that most marketers struggle here because their data is scattered across nearly a dozen different platforms. Manually compiling reports is a time sink that keeps you from making these critical decisions. If you feel like you're drowning in raw numbers without clear insights, it’s likely time to move away from manual spreadsheets and toward a unified ad reporting tool that connects your metrics directly to your next move.
How an Ad Reporting Tool Simplifies Everything
An effective reporting tool goes way beyond just visualising data. It brings structure to what is often a fragmented set of platforms and metrics. Instead of logging in and out of multiple tools, you get a single, unified view of your performance.
A Single Source of Truth
Stop jumping between tabs. Bringing your Google Ads and Meta Ads dashboards into one interface lets you see how your campaigns are performing across the board.
Automated Trend Detection
Strong tools surface performance shifts automatically, so you don’t have to dig through spreadsheets to figure out what changed or when it happened.
Turning Insights Into Action
Some platforms go a step further by suggesting optimizations. This shortens the gap between identifying an issue and taking action.
Streamlined Reporting
Instead of rebuilding reports each week, you can generate structured overviews in seconds. This makes reporting faster and more consistent.
Ultimately, tools like OptAdEasy are designed to solve a common challenge: how to track ad performance effectively without getting overwhelmed by the process. Reducing the manual workload allows teams to spend more time on strategy and less time compiling data.
Go Beyond Your Data with Competitor Insights
Internal metrics only tell part of the story. If you focus solely on your own numbers, you risk marketing in a vacuum, where it becomes harder to understand how your campaigns stack up in the wider market.
Strong marketers look beyond their accounts. They track how competitors evolve their creatives, messaging, and landing pages over time. These patterns highlight gaps and opportunities that your internal data alone cannot surface. Most marketing dashboards focus strictly on your own performance. While useful, they often miss the external context needed to make sharper decisions.
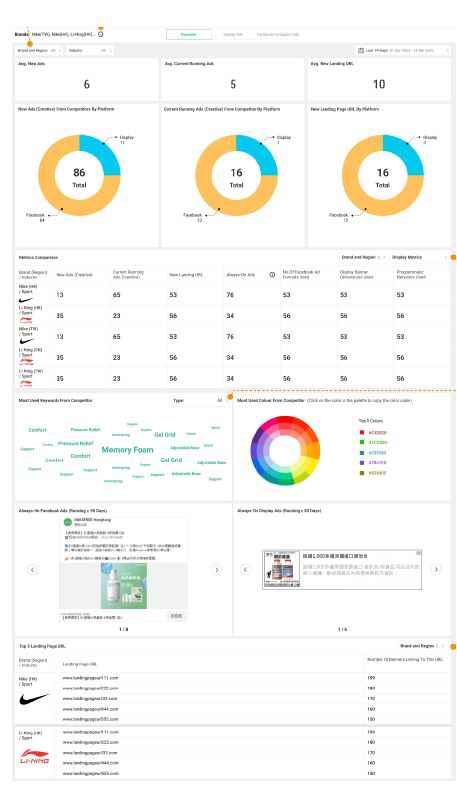
This is where OptAdEasy’s Competitor Stalking feature comes in. It gives you visibility into competitor activity without the need for manual research. You can monitor ad creatives, keyword trends, and landing page strategies in one place.
And when you combine this competitor insight with your own performance data, you move from reacting to results to making more informed, proactive decisions.
Go From Data Overload to Clear Decisions with OptAdEasy
The reality is, dashboards are not the problem. The real challenge is interpretation. Once you can read trends, spot meaningful changes, and connect metrics to action, your data starts working for you.
The next step is making that process easier. An ad reporting tool like OptAdEasy brings your marketing dashboards into one place, highlights what matters, and helps you act faster without digging through layers of data.
If you want to simplify your digital marketing analytics and make faster, more confident decisions, a unified platform can make a real difference.
At its core, strong performance comes down to clarity. The teams that win are the ones that can quickly see what is happening and know what to do next.
Ready to take control of your data? Try OptAdEasy and start turning your marketing dashboards into clear, actionable insights. Sign up for a free trial today.